NORWAY
|

|
For technical or for any media enquiries related with region/country specific information, please contact us.
Threat Ranking
Proportion (%) of threatened amphibian species (red) in the country, relative to the closest 14 countries in the global ranking. The remaining proportions indicate non-threatened (sky-blue) and data deficient (grey) species per country. 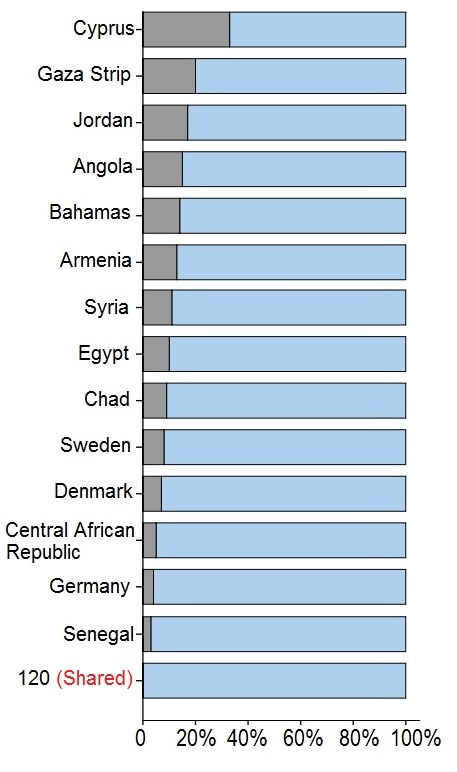
|
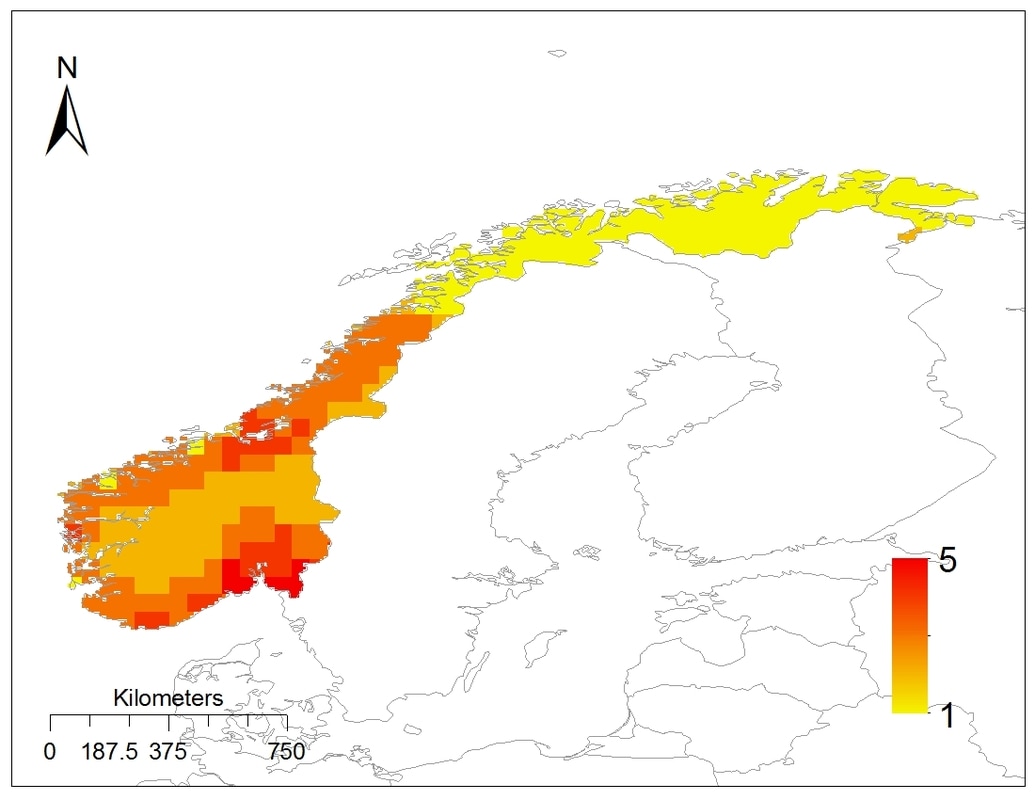
Top Map: Distribution of hotspots of amphibian species-richness in the country (the bar on the right indicates the number of species found within the same area)
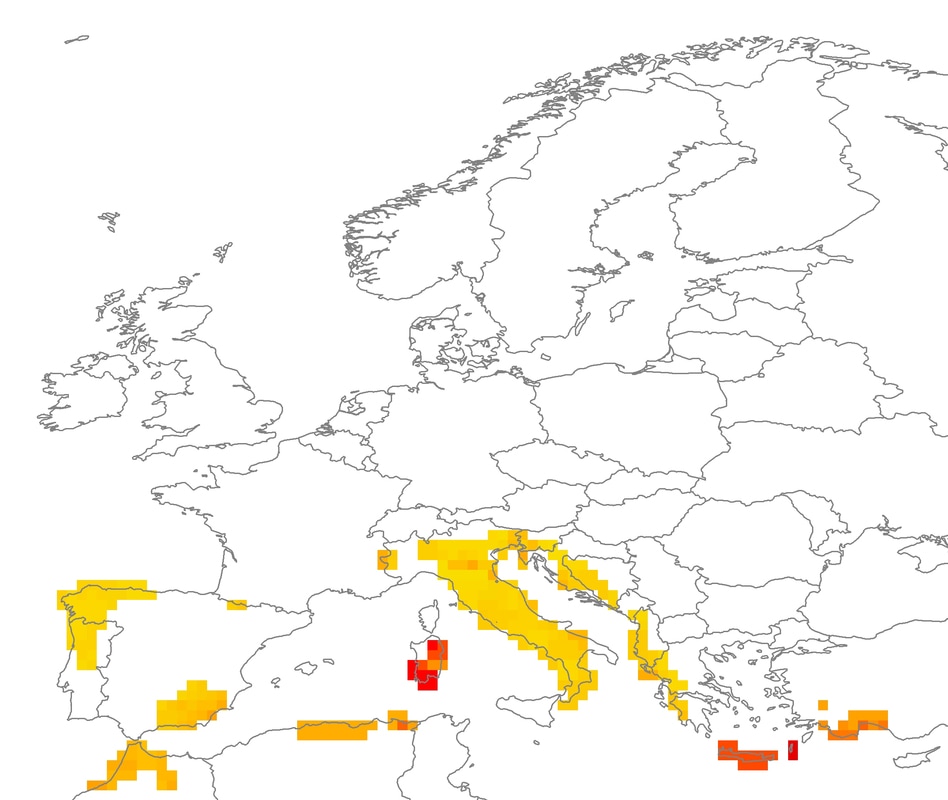
Bottom Map: Proportion of species classed as threatened relative to the total species present per area in the map (% shown in the bar on the right). The proportions of threatened species have been adjusted to account for species classed as Data Deficient (as described here).
|
Copyright © 2017 Daniel Pincheira-Donoso
Laboratory of Evolutionary Ecology of Adaptations
School of Life Sciences - University of Lincoln
Lincoln, LN6 7DL, United Kingdom